Job Traces
The job traces workspace gives a view into the series of jobs that are executed as part of a larger root job providing for a quick, efficient way to identify and troubleshoot failures or performance opportunities in large data pipelines.
The job traces workspace displays a list of root jobs (jobs that are not child jobs of other jobs) that have run or are currently running and provides visual references to the progress and status of a root job, including all related child jobs, with the ability to drill into root and child jobs further.
By default, the job traces list is sorted in descending chronological order, but specific job traces can be filtered by clicking the search icon in the upper left corner of the list panel. Refresh the list by clicking the refresh icon in the upper right corner of the list panel.
Note
Child jobs cannot be searched in the job traces search but are part of the job trace details and timeline.
Clicking on the name of a job trace in the list displays the details and timeline for that job in the main view.
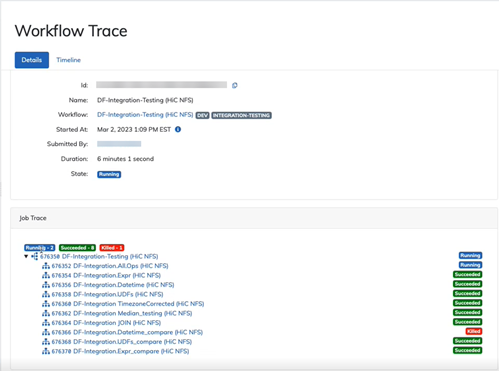
Job Traces Details
The job traces details tab contains 2 sections.
-
General Displays job trace metadata such as the name, ID, start and end date/time, submitter, duration, and state.
-
Job Trace Shows a nested hierarchical list of the root and child jobs. Each job listed can be clicked to navigate to that specific job for more detail. To the left of each job is an icon indicating the type of job. Check out the Understanding Job Types to learn about each job type. To the right of each job is a status badge showing the current job state.
- Blue indicates the job is running.
- Green shows that the job has completed.
- Red denotes the job has failed or was killed.
Directly above the hierarchy list are overall status badges summarizing the number of root and child jobs that are running, have completed or were killed/failed.
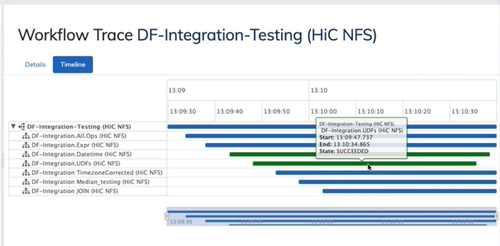
Job Traces Timeline
The job trace timeline tab presents a Gantt chart of root and child job progress and status that updates in near real-time with lines indicating the status and duration of the job. The time of day runs across the top of the Gantt chart while the jobs are listed on the left as they begin. Job type icons conveniently appear to the left of the job for reference as well.
Tip
Use the triangle next to jobs to expand or collapse the nested child jobs in the job trace hierarchy list and timeline. 
The lines in the Gantt chart illustrate the status, time and duration of the job.
- Blue line is a job that is in progress.
- Green line is a job that has completed.
- Red line is a job that has failed or was killed.
Tip
Hover over a line in the Gantt chart to reveal a details box with the job name, root job name, start and end time, and state.
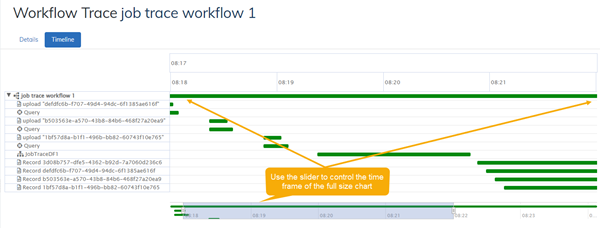
Below the timeline is a navigational timeline where adjustments to the right and/or left sliders control the view of the full Gantt chart above.
Working with Job Traces
Job traces provide visibility to the larger data pipeline to identify and troubleshoot failure points or opportunities for performance optimization.
To drill into a specific job that is part of the larger job trace, click the link in the job trace section on the Details tab of Job Traces to be redirected to that specific job. From that job page, reference links, buttons to view objects and other information are available.
To go from a specific job to the root job trace, locate the root job in the job trace section of the job. Click the link for the job identified as the Root. The root job will open. Copy the ID for that job. Navigate to the job traces menu and paste the ID into the search. This will return the full job trace that included the original job.