Inspecting Data in Aunsight
Aunsight datasets are a powerful and scalable abstraction for working with large collections of data. Datasets can sometimes contain billions of records and gigabytes of data, making it impossible for humans to review their contents. Yet in as many cases, human intelligence gained from inspecting the data can be the essential for exploration and uncovering the stories hidden within the data. Additionally, reading portions of a dataset is an important way to understand how to apply ETL transformations for cleaning and normalizing data. For this reason, Aunsight datasets provide several tools for inspecting datasets stored on the platform regardless of their size.
Tools for Inspecting Data
Aunsight provides three tools for inspecting data:
- Peeper Report
- Explore
- Browse
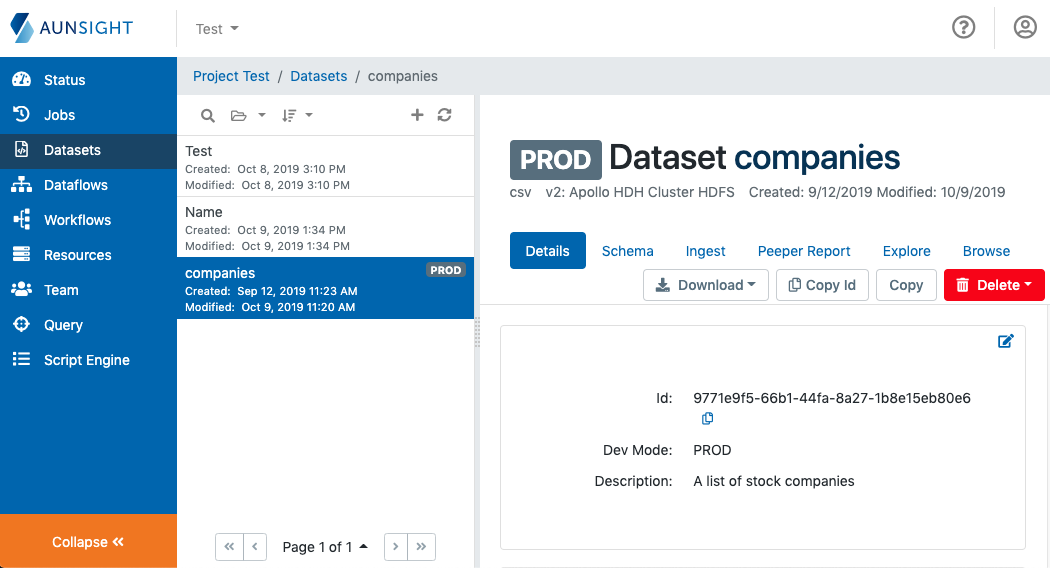
All of these tools are located in the tabs of the dataset records themselves. To access the tools, log in to the Web interface and select the relevant context you wish to work in. Click the "Datasets" icon (![]() ) in the palette on the right and select a dataset you would like to explore.
) in the palette on the right and select a dataset you would like to explore.
The three tabs named Peeper Report, Explore, and Browse offer tools to inspect data. The remainder of this article explains what each tool does and how it can be used.
Peeper Reports
Peeper Reports are an analysis of the basic statistics of a dataset. Creating Peeper reports is a resource intensive platform process, and not every data structure will yield informative results, so peeper reports are run on demand rather than as a regular part of dataset maintenance. Moreover, because a peeper report is based on the contents of a dataset, changes to the dataset require the process to be run again.
Note
Peeper Reports examine data by field, so they are not appropriate for complex datasets which include JSON or multidimensional structures (e.g. feature bagging), so it is a good practice to examine a dataset with the browse tool to see if the data is a good candidate for a peeper report before running this resource-intensive process.
To run a peeper report, click the "Peeper Report" tab from the dataset workspace and click "Run Report." This will launch a structured-peep job that will walk through the data contained in the dataset to generate a report upon completion.
Warning
Peeper reports run on LDJSON data will fail because this format does not have the required structure to generate a report.
To view a peeper report, click the "Peeper Report" tab from the dataset workspace and scroll through to the report.
The General Stats section displays a list of fields and their data types, and the number of rows in the dataset. This provides some understanding of the schema of the dataset.
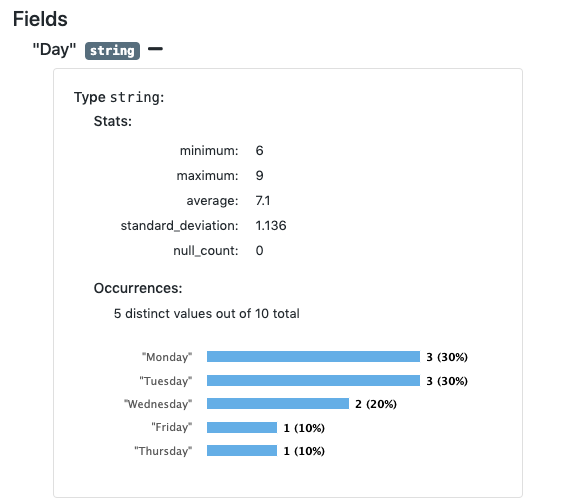
The Fields section displays expandable sections for each field showing statistics for that field including:
- The length of the smallest value found in this field.
- The length of the maximum value found in this field.
- The mean average length of the values found in this field.
- The standard deviation from the mean.
- Number of fields with
Nullvalues in this field.
Fields will also display a chart showing the distribution of the most common values.
Explore
The explore tab allows users to easily issue simple queries for data exploration. Explore enables users to run queries on a single dataset via a graphical user interface. Behind the scenes, Aunsight executes these through its query service using the Apache Drill query language, a NoSQL query language for big-data filesystems like Hadoop and cloud storage services.
To create a query, click the "Explore" tab from the dataset view to bring up the explore tool.
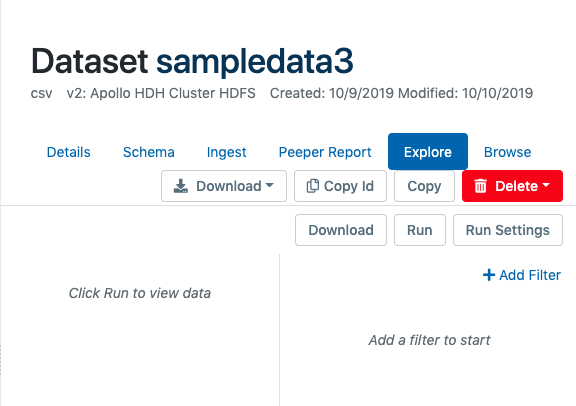
To begin adding a query filter, click "Add Filter" on the right and select a feature (field). Next choose an operator or the filter expression (e.g. "Equals" or "Contains") and then specify a value to use for the operation. When the query conditions are complete, click "Run" to run the query or "Download" to process the job and download the results via a link sent upon the query job's completion.
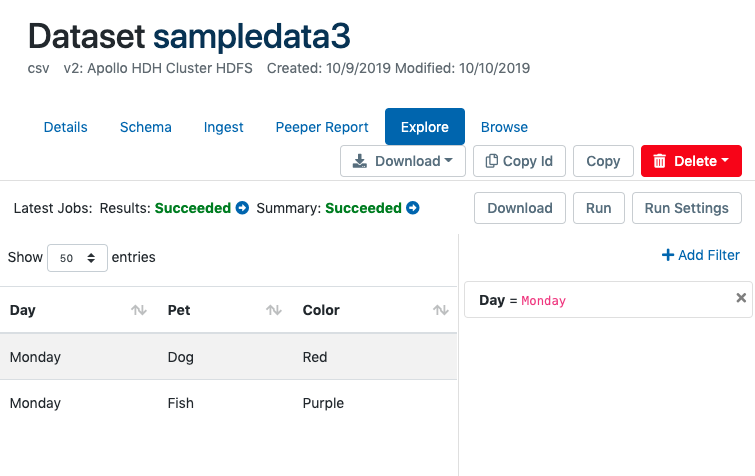
In this query example, Aunsight will execute something like the following in Drill syntax:
SELECT *
FROM AU('my_dataset_id')
WHERE ('Day' = 'Monday')
By providing this tool, Aunsight allows data scientists to interactively explore a dataset to find patterns within data before initiating time and resource-intensive machine learning and modeling processes.
Browsing
One of the simplest tools for inspecting data is the browse tool. As its name suggests, browse allows uses to page through datasets as easily as turning the pages of a book. Browse provides two different ways to inspect data page by page: in table or in raw form.
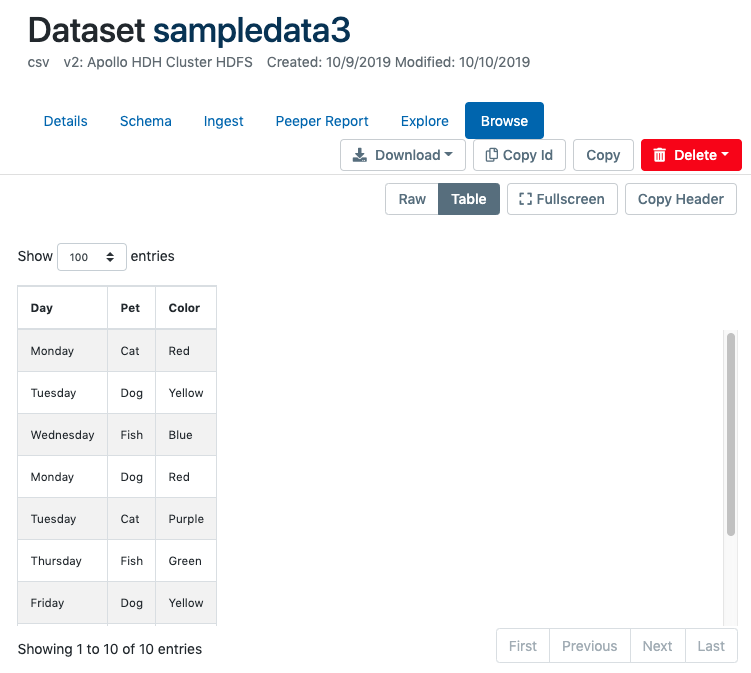
Browse by Table
By default, Aunsight displays browse data in a tabular form based on the schema defined for the dataset. Users can specify displaying data in pages of 100, 500, or 1,000 record increments and navigate through each page to view as much of the dataset as they would like.
Browse Raw Data
Occasionally, users may wish to browse the data in raw format. This can be useful if there is no schema or if there is a problem with the schema that causes garbled output. For example, corruption of the delimiter in some records can break the schema, causing unpredictable output and improperly separated fields.
Browsing a dataset will initiate an Aunsight download job that retrieves the first 10kb of data from the start of the dataset and displays it in its raw format. You can page through the dataset in 10kb increments.
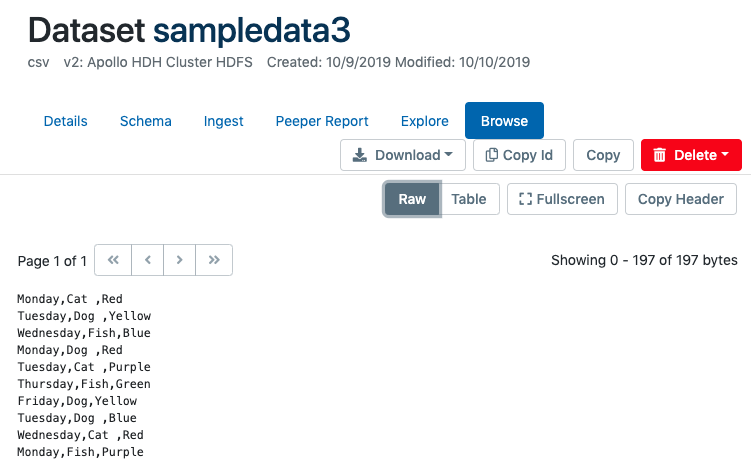
When paging through raw data, bear in mind that each "page" ends at the ten-thousandth byte, regardless of whether that byte occurs in the middle of a record row. This means paged data can sometimes display only part of a row, and the subsequent pages will likely begin displaying data mid-record, or even in the middle of a field.